SketchUp's Generate Report service creates tables of information based on the objects in your models. This is useful for creating materials lists and estimates. Each column in a report corresponds to an attribute from the objects in your model. The rows in the report are the attribute values. You can create complex reports directly from SketchUp by using the Group By and Aggregate features.
Attributes are best supported for Components. Components have a central "definition" in your file. This makes it easier to work with multiple copies of the object in your model. When you make edits to the definition, all instances (copies of the definition) receive those updates. Groups do not share a central definition and do not update automatically. Attributes such as Definition name, Type and Price apply to the definition. Other attributes such as Tag, Owner and Status are instance specific. Instance specific attributes are useful for more generalized attributes about that particular instance of the component definition such as where it is in your design (floor 1 vs floor 2) or who is responsible for it or whether it's been completed.
Attributes can come from a variety of sources. Some Attributes are object-specific such as the object's xyz position or bounding box lengths (LenX, LenY, LenZ). Attributes such as Tag, Classifier Type or Price can be assigned using entity info. Attributes can also come from extensions or from the Dynamic Component Options Options dialog.
Numeric values from attributes can be aggregated to create lists and sums. This is useful for seeing how many of a specific size thing you have in your model or for totalling values.
Report Templates
Templates control all the settings for a report. Generate Report allows you to create and save Templates so you don't have to build a report from scratch. Report Templates can be stored in your skp files or they can be transported as ".grt" files. To get started, you can click the Create New Template button or you can edit one of the default templates.
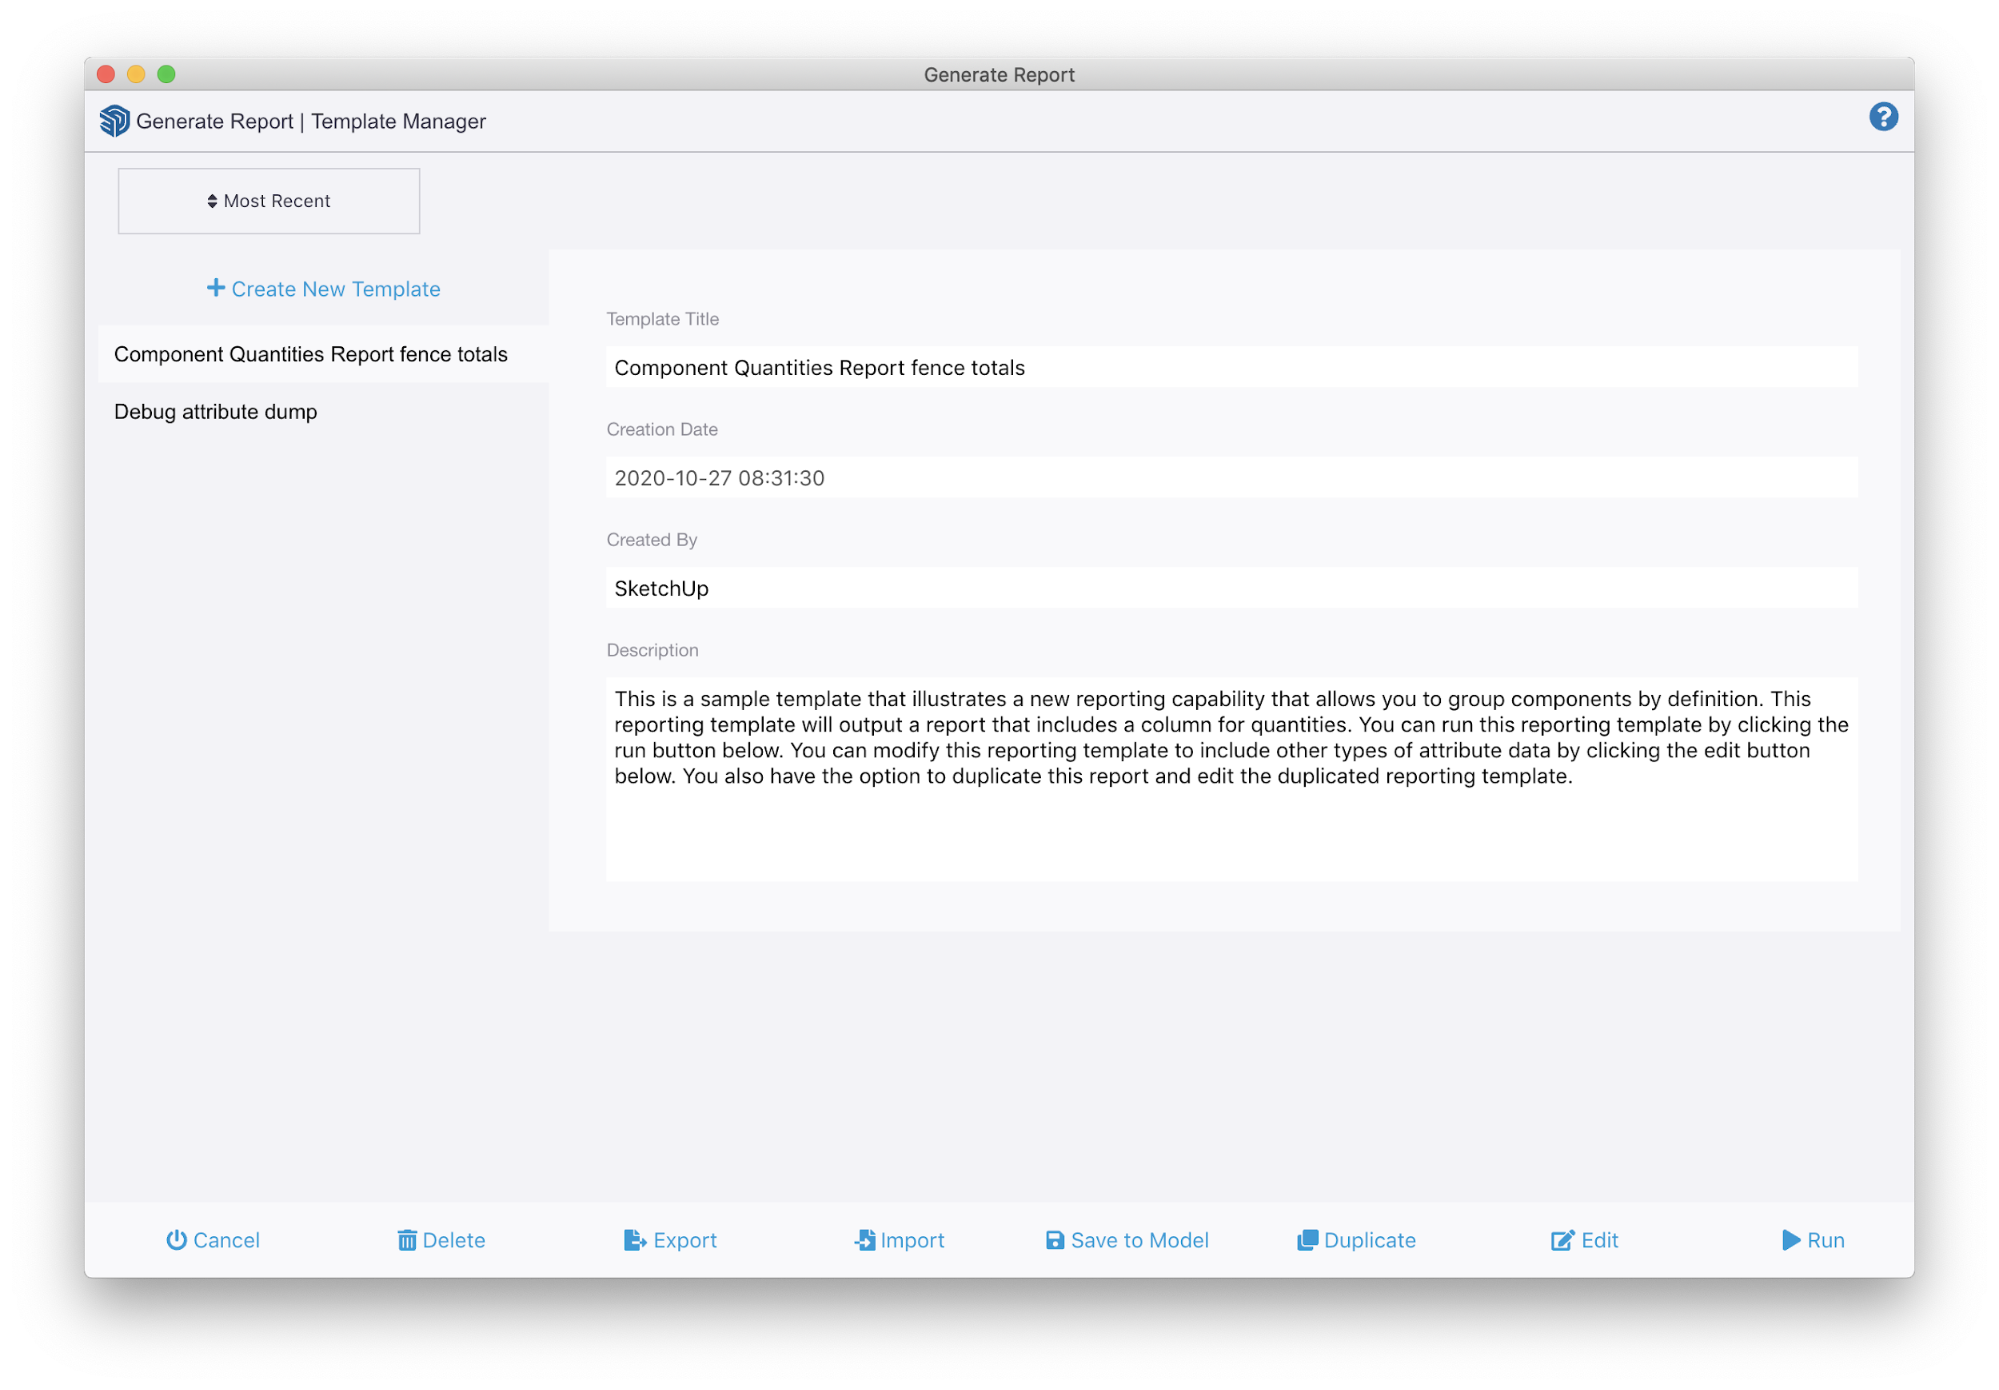
The buttons at the bottom of the main view allow you to manage and edit templates or run a report.
- Cancel - Closes the Generate Report Window.
- Delete - Removes the selected template from your skp file.
- Export - Saves the selected template to your computer as a GRT file.
- Import - Allows you to open a .grt file previously saved to your computer.
- Save to model - Saves your template to your skp file.
- Duplicate - Makes a copy of your selected template. This is useful for making edits to an existing template.
- Edit - Opens the template editor where you can manage attributes and settings. See Formatting a report for more information.
- Run - Will display a preview of the report. If you are satisfied with the preview, you will be able to download the report as a .csv file.
Formatting a report
Report templates control three elements:
- First, they determine how objects in your model are selected for inclusion in the report using selection filters.
- Second, report templates control which attributes are included in your report. Each attribute corresponds to a column in your report. The ordering of your attributes from top to bottom, will match the ordering of your columns from left to right. Custom names each column can be specified in the attribute settings pane.
- Third, your report template controls how attributes are grouped and aggregated which is useful for totaling quantities or other numeric values.
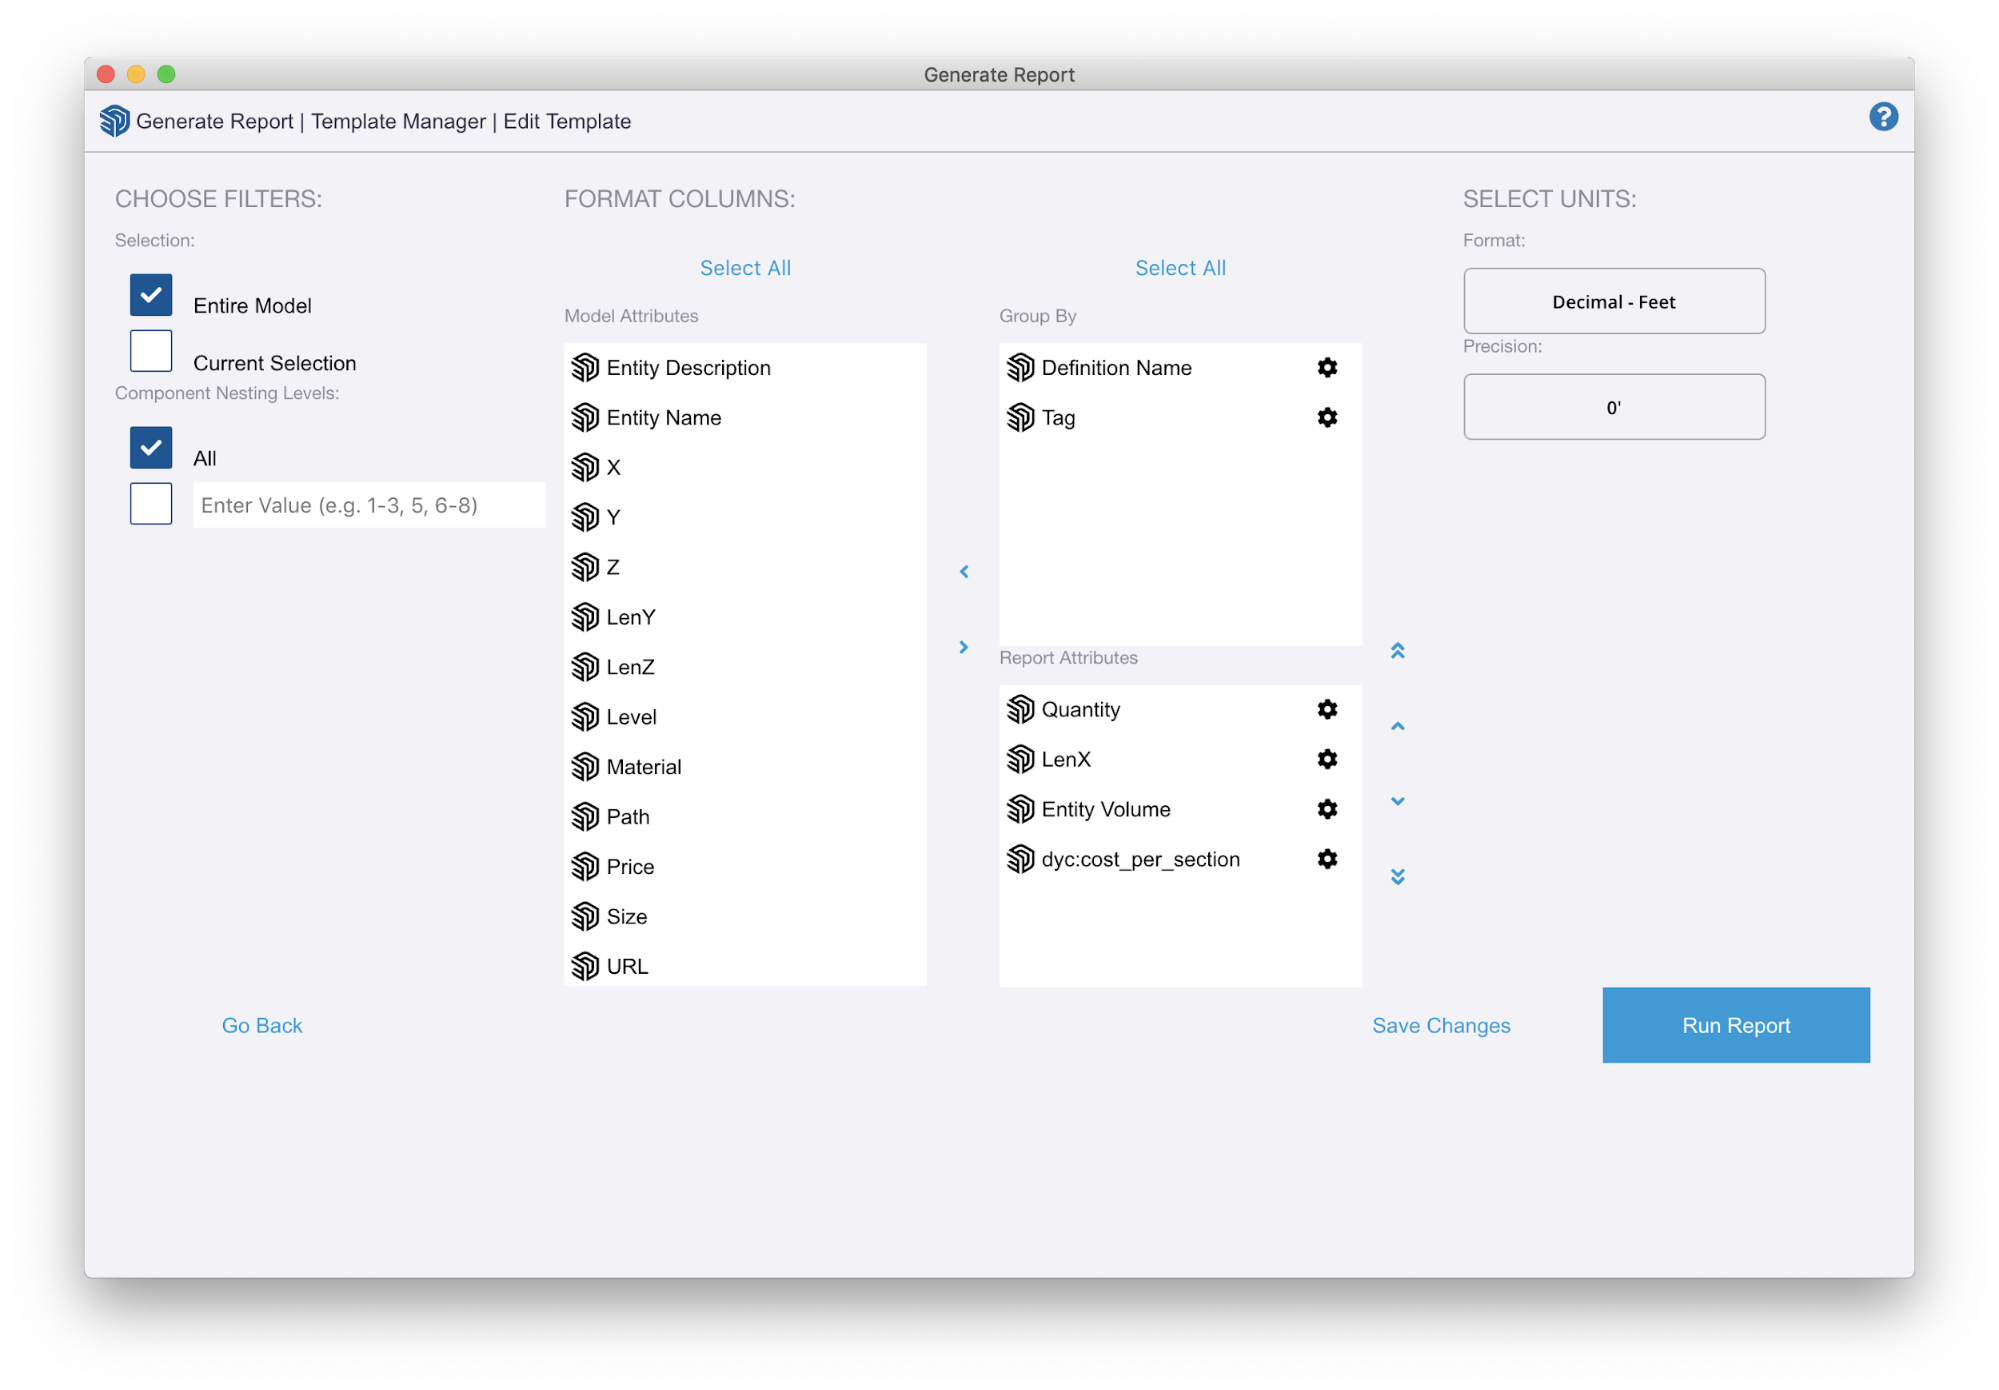
The default template is the Component Quantities report. This template lists out the names of all the components in your model and gives the quantity of each definition. This is accomplished by placing the "Definition Name" Attribute in the Group By field and then having the Quantity attribute in the Report Attributes. For more info see How to specify Group By attributes to Aggregate values.
Selection Filters
There are two ways to filter how objects are selected for inclusion in a report. You can choose to run a report on the entire model or just the current selection. If you use current selection, be aware that you need to correctly select all your objects before you open the Generate Report Service.
You can also filter selections by Component nesting levels. Level 1 is your root model. Level 2 is the first level of objects in your model. Level 3 and above are the nested objects inside components. Much of the time you will want to select only the top level components in your model so you will often set your nesting level to: "2". You can specify a range of levels simpler to how you specify pages to be printed. For example entering: "2-4, 6" would run your report on levels 2, 3, 4 & 6.
Formatting Columns for your report
Any of the attributes assigned to objects in your model can be added to your report as a column. The Model Attributes Field lists all available attributes in your model which can be added to a report template.
To set up a report, move attributes from the Model attributes field to the Group by and Report Attributes fields. Attributes can be moved around by clicking and dragging on a selection or by first selecting and then using the arrows to add and remove attributes. Note that you can only place attributes in the group by column by clicking and dragging. The vertical order of attributes in these fields will determine the order of the columns in your report horizontally from left to right. Column names can be customized by clicking the Gear icon for each attribute.
How to specify Group By attributes to Aggregate values
The Group By feature is a way to collect attribute values into lists or totals for cells in your report. This is useful for determining quantities or adding up values such as prices. Group By works by specifying certain attributes to use for collecting other values. Normally the Group By attributes are text based strings like Definition names or tags. This allows you to group numeric values by these text based "labels". Once you've specified an attribute for grouping, all other attributes can then be aggregated in three different ways (if appropriate). Another way to think about Grouping by is that it condenses multiple rows in a report into a single row. This means that the cells in other columns will have multiple values and you need to choose how you want those values displayed. For example if you group by Component Definition Name, you will have one row for each component definition while other attributes such as price or volume can be displayed in a list with counts, as subtotals or totals.
You can specify multiple attributes to group by. For example if you group by Component Definition Name and then by Tag, you will end up with one row in your report for every pair of a component definition name and tag. If you had prices, this would allow you to calculate total price per component definition per tag.
Editing Attribute Settings
Once an attribute is added to your report you can change its name as it appears in column headings and control how attributes are aggregated for grouping.
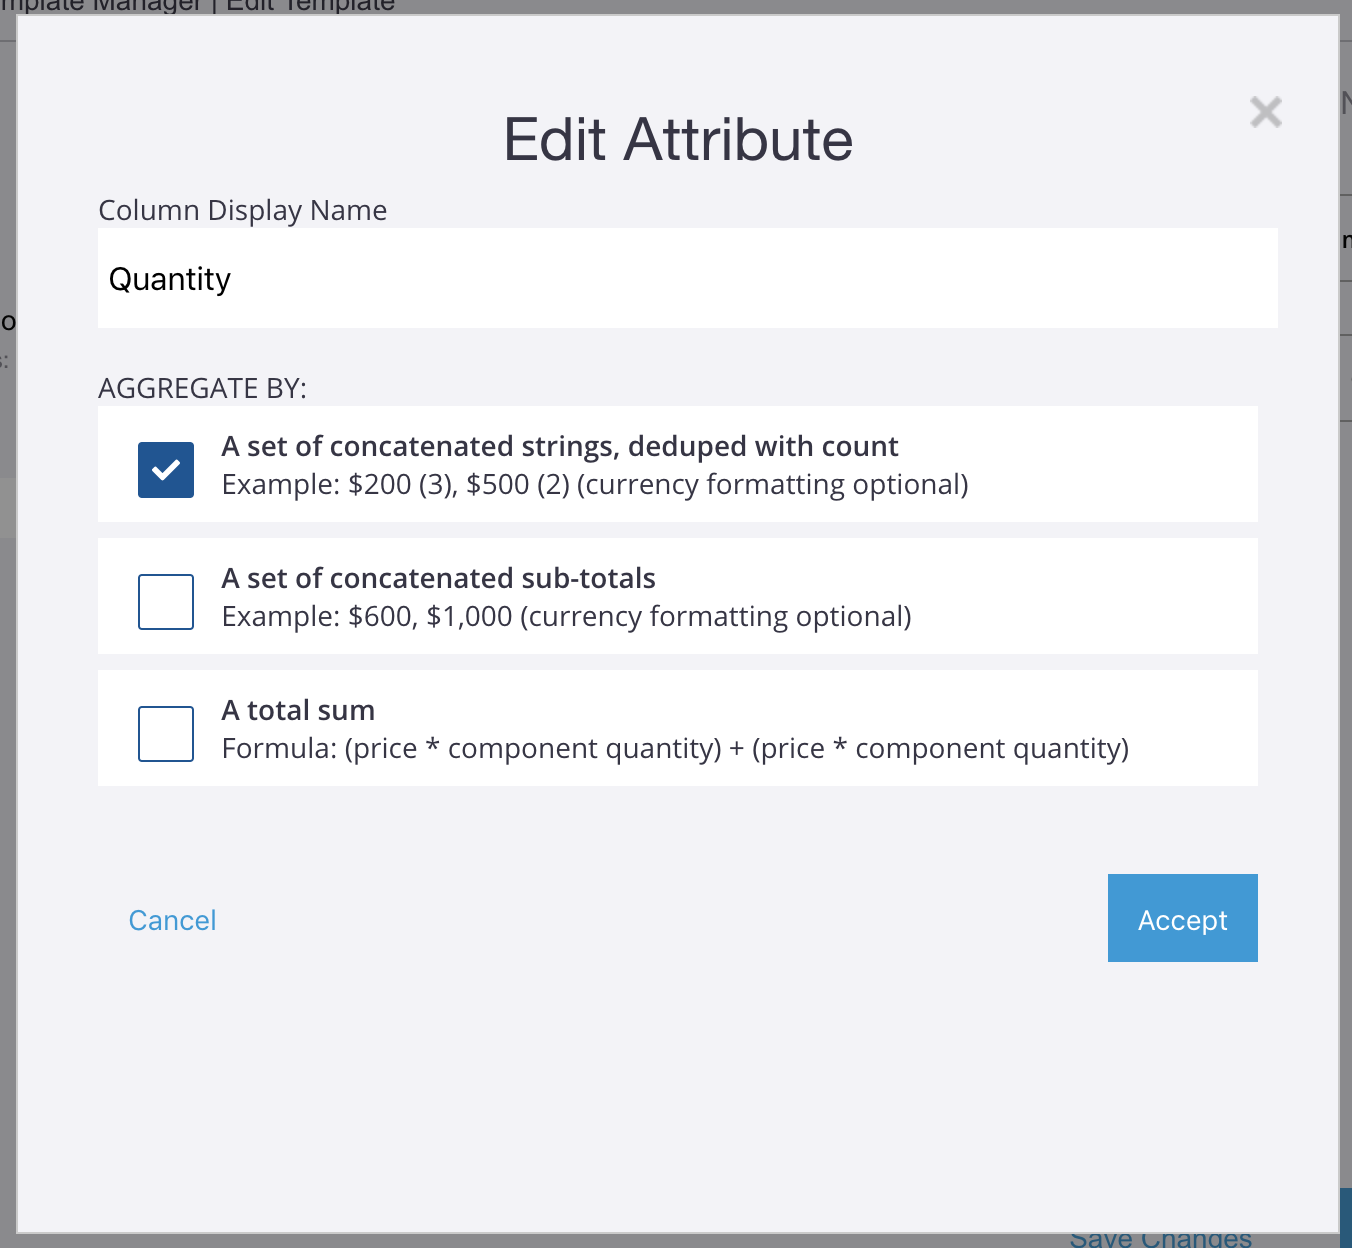
Column display name
Column names will default to the attribute name. If you want to change the name in your report columns, enter a new name and click accept.
Aggregate By settings
When other attributes are used for grouping, attributes in the Report Attribute field can be aggregated. There are 3 options for aggregating:
- A set of strings with counts will group the values into unique values and quantities of those values. Results will appear in the following format - Value (count), Value (count), etc...
- A set of subtotals can be collected if your values are numbers like price or length. Subtotals are given based on your number * the quantity.
- A total sum will add up all the subtotals into a single value for the whole group. Examples of this would be total price for all component definitions in the row.
Select Units
The default units for your report will match the Units for your model. Different units can be specified using the Select Units dropdown. The precision level controls how many decimal places are displayed. Note that numbers are always rounded to meet the precision settings.
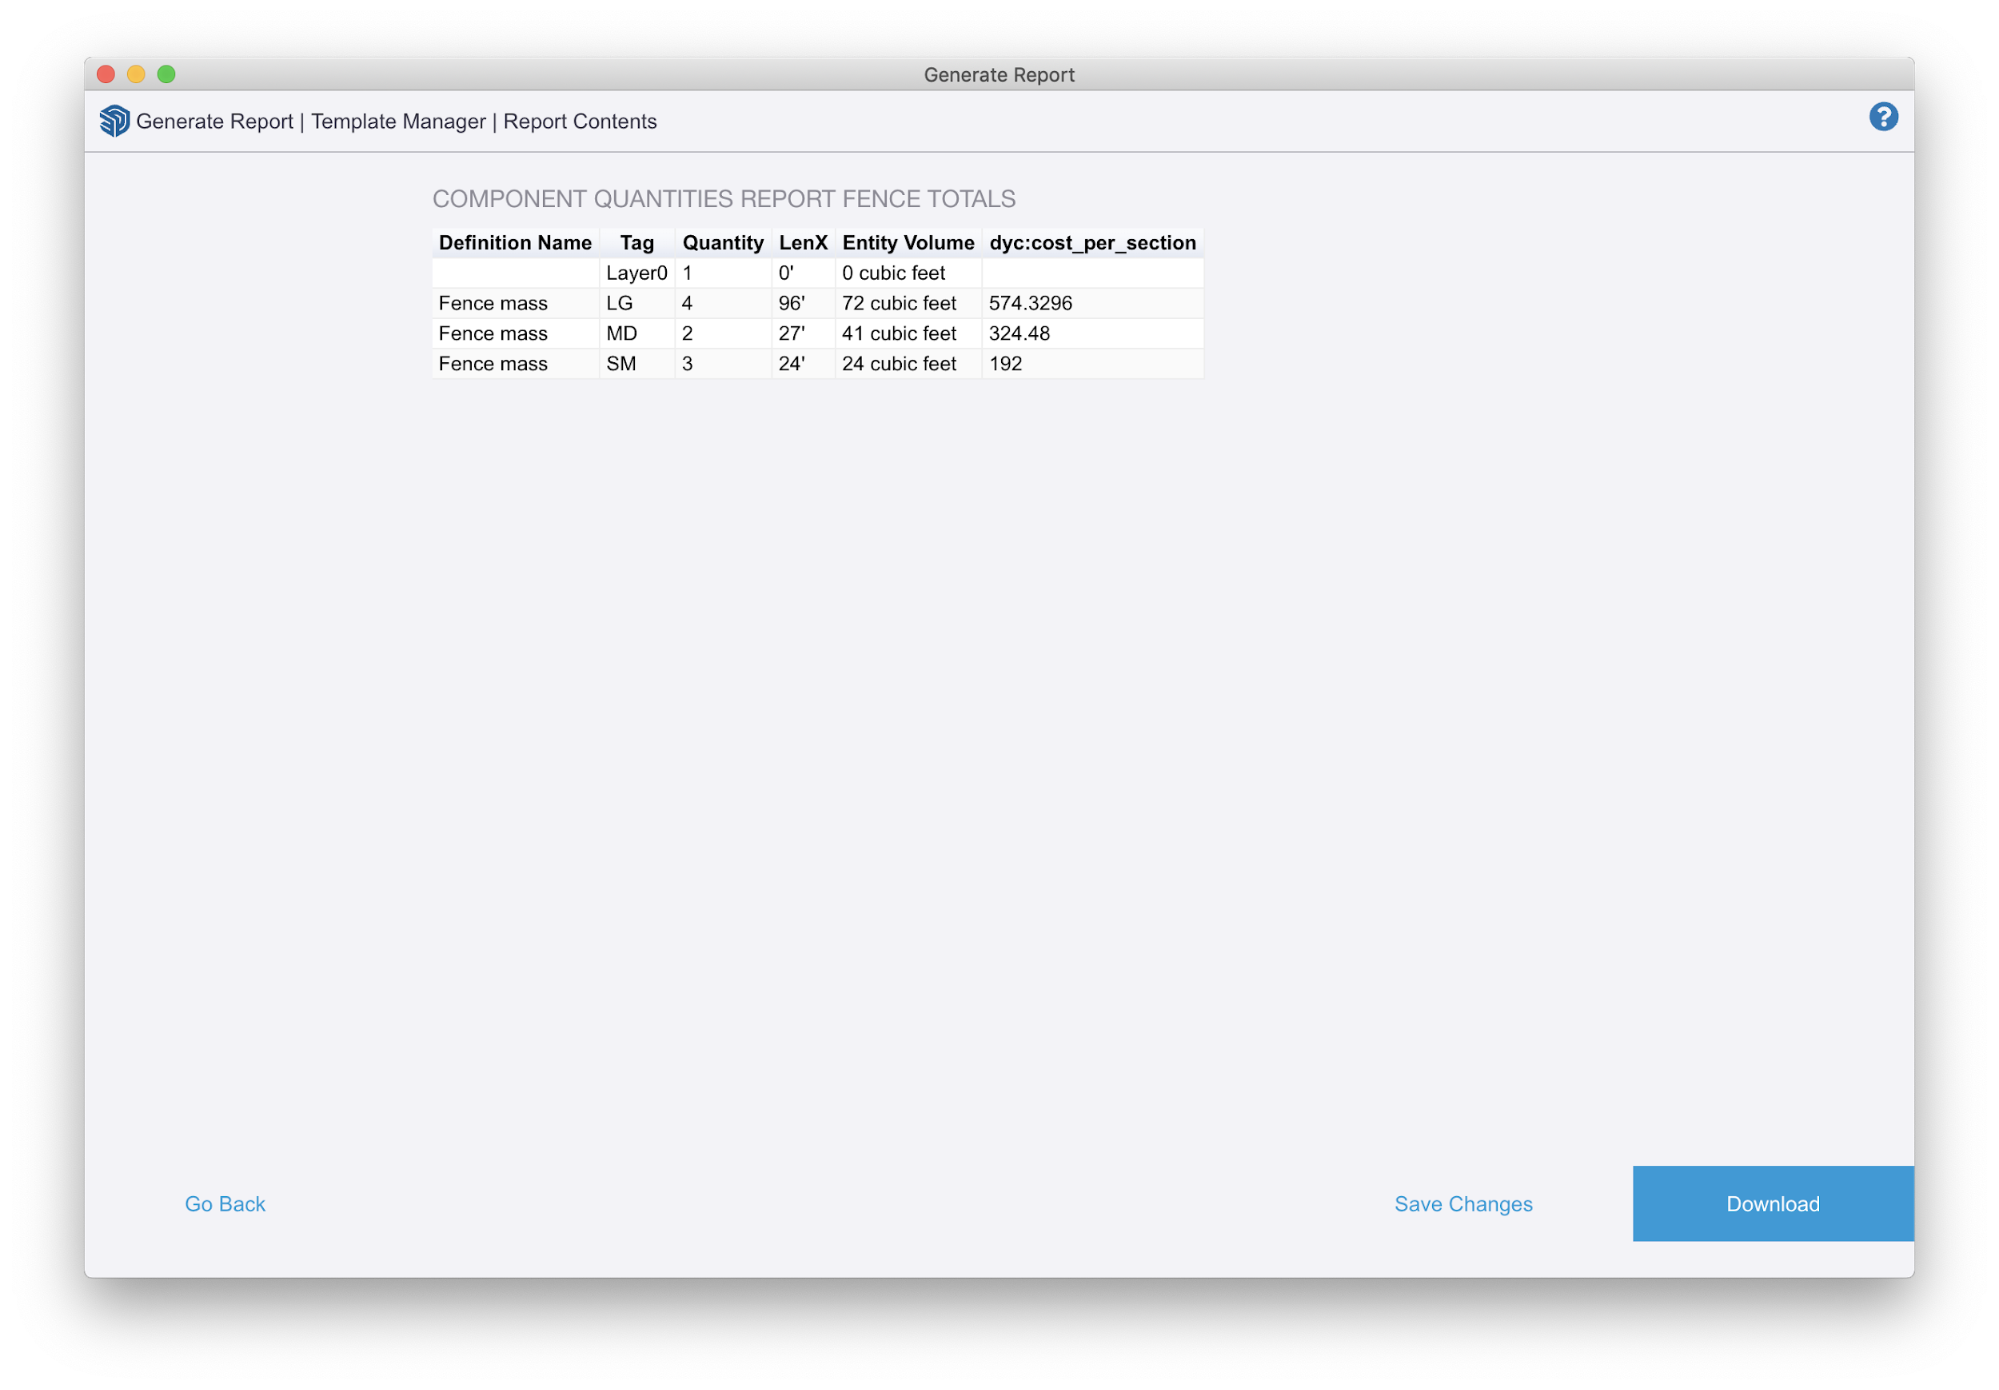
Report Contents Preview
When you click the run button you can preview the Report Contents before downloading a CSV file of your report. If you need to edit your report click the Go Back button to change the template. If you are satisfied with your report click download to save a .CVS file to your computer. CSV stands for comma separated value. These files can be opened in any spreadsheet application.