Working out what the climate means for your architectural design
Weather analysis is great but a lot of people struggle to understand what it means for the actual design of buildings. This page aims at helping you draw links at the highest level between what the climate is like and how you should think about designing your building.
Characterising your climate
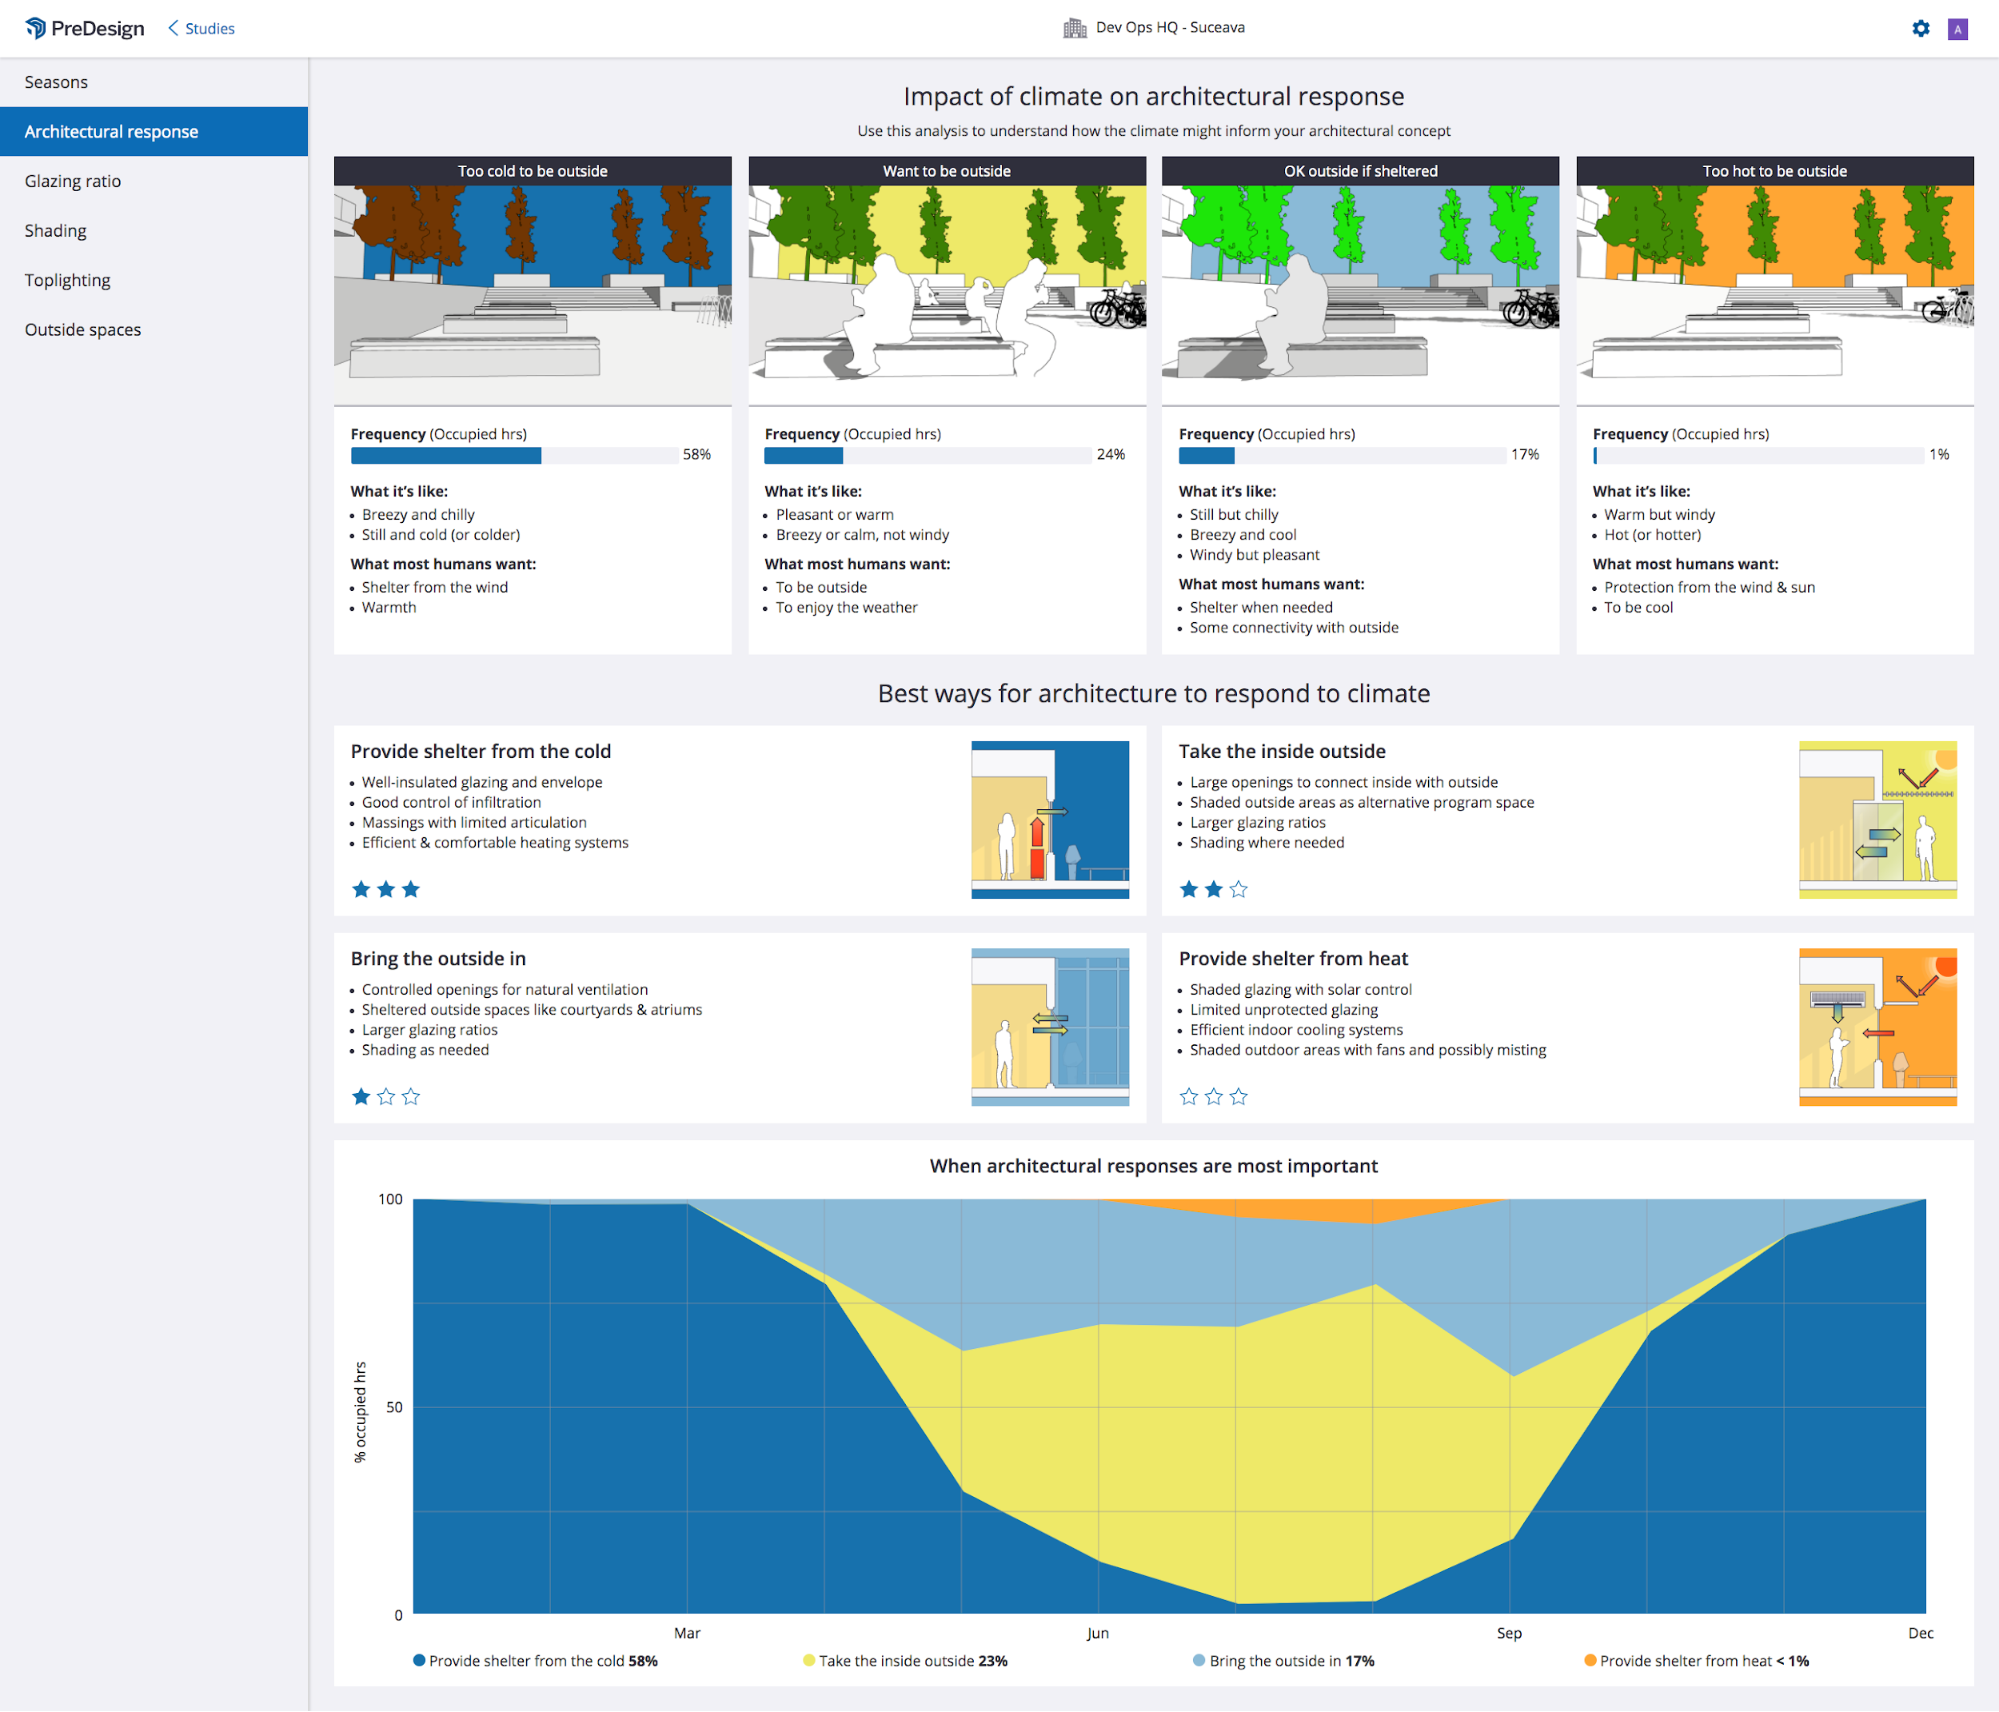
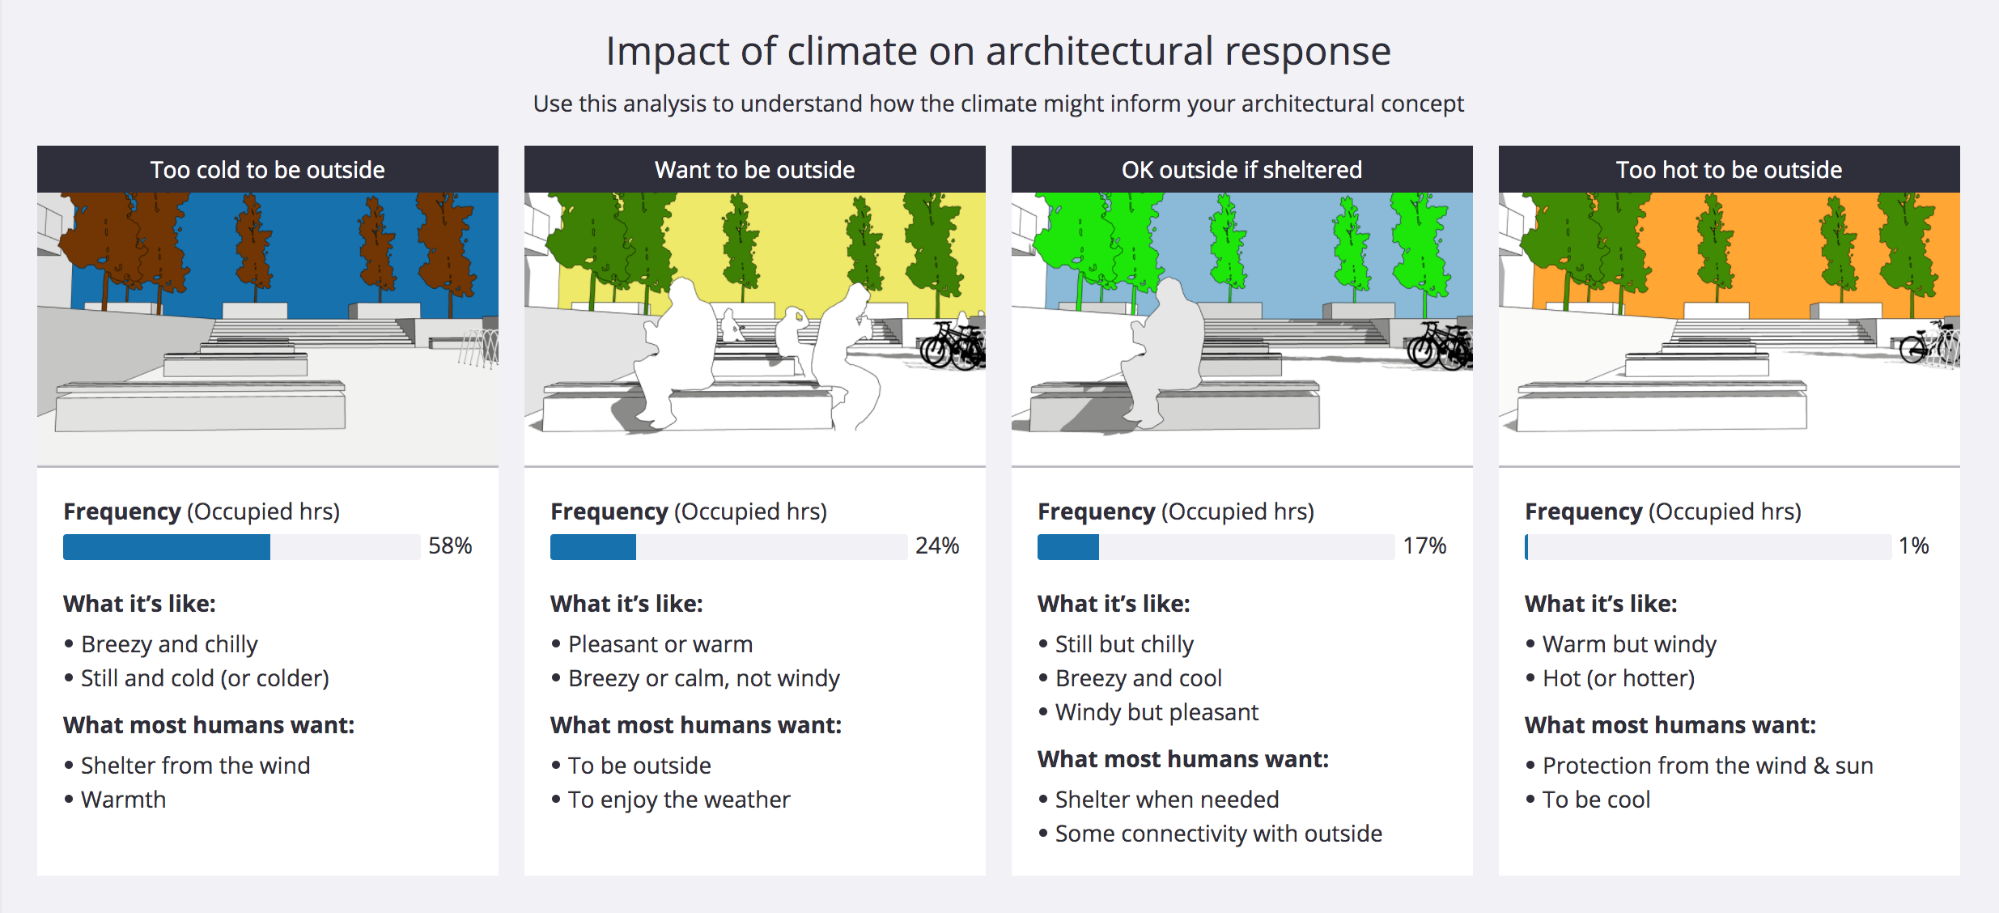
The first think we’ve done on this page is divide the historical weather conditions for the site into 4 broad categories that relate to how people feel about the conditions at any point in time:
- Too cold to be outside
- OK outside if sheltered
- Want to be outside
- Too hot to be outside
You can find out more about how we define these here. These definitions are used to help connect the dots between the climate and appropriate architectural responses.
The 4 categories are sorted based on most common (left) to least common (right), showing the % of occupied hours where this condition is present.
Use this to help simplify the climate into terms that make sense to the whole project team and to draw the dots between the climate and design implications.
Architectural Responses
There are 4 different architectural responses, each of which aligns with one of the climate characteristics above. The responses and how they are linked to the climate are as follows:
| Climate Characteristic | Architectural Response |
| Too cold to be outside | Provide shelter from cold |
| OK outside if sheltered | Bring the outside in |
| Want to be outside | Take the inside outside |
| Too hot to be outside | Provide shelter from heat |

Each architectural response comes with suggested ways to prioritise different strategies in your design. For example, if your response is to provide shelter from the cold, then you should make sure your building is well-insulated and air-tight.
You can use these explanations to help join the dots between the climate, how it makes people feel and how you should then prioritise different features in your design.
The star ratings are designed to help you quickly assess the relative merits of different big ideas and discuss them with your client. Although more stars mean that a certain response will be effective more often, there is no strict rule and the stars are provided as a guide to steer the project in a good direction before you start your 3D model.
Chart to show when it happens
Underneath the architectural response recommendations, there is a chart that shows when different responses are relevant over the year.

Use this chart to get a sense of when different responses are most important across the year. If you’re struggling to prioritise different approaches it can help you visualise how prevalent different situations are at different times. For example, in this graph you can see taking the inside outside is something that happens all year round, whereas providing shelter from the cold is mainly confined to December and January.