What kind of weather data does PreDesign use and where does it come from?
This article provides detail on the underlying data used in the guidance provided by PreDesign. Use this article to:
- How to choose a weather file
- Where the weather data used in PreDesign comes from
- What the weather data is comprised of
- Which sites are covered
- How we decide when to filter-out weather data
Where the weather data in PreDesign comes from
PreDesign provides the choice of two sources of weather data for creating studies.
- Satellite weather data from Meteoblue. This is the default weather data used and almost all comes from the ERA5 data set which is estimated data from satellite readings. This data has a 30km grid, meaning that the historical climate data used will almost always be within ~20km of your site. This weather has complete precipitation and wind data.
- Weather station data comes from Climate.OneBuilding (http://climate.onebuilding.org/default.html) website. Weather files that available at Climate.OneBuilding are typically used for code compliant energy and annual daylight calculations in energy calculation software (including Sefaria). This weather data is from recorded weather stations. This source does not always have complete wind data and often does not have precipitation data.
Choosing a weather file
Satellite dataWhen you enter your location into PreDesign, we’ll automatically choose satellite weather data that is closest to your site. In this instance you do not need to do anything other than entering the location. Our expectation is that this weather data will provide the best experience when using PreDesign.

Sometimes if you are using weather station data for other analysis and want to have consistent weather data (for example an energy model) or if for some reason we are not able to provide satellite data at this time, weather station data can be useful.
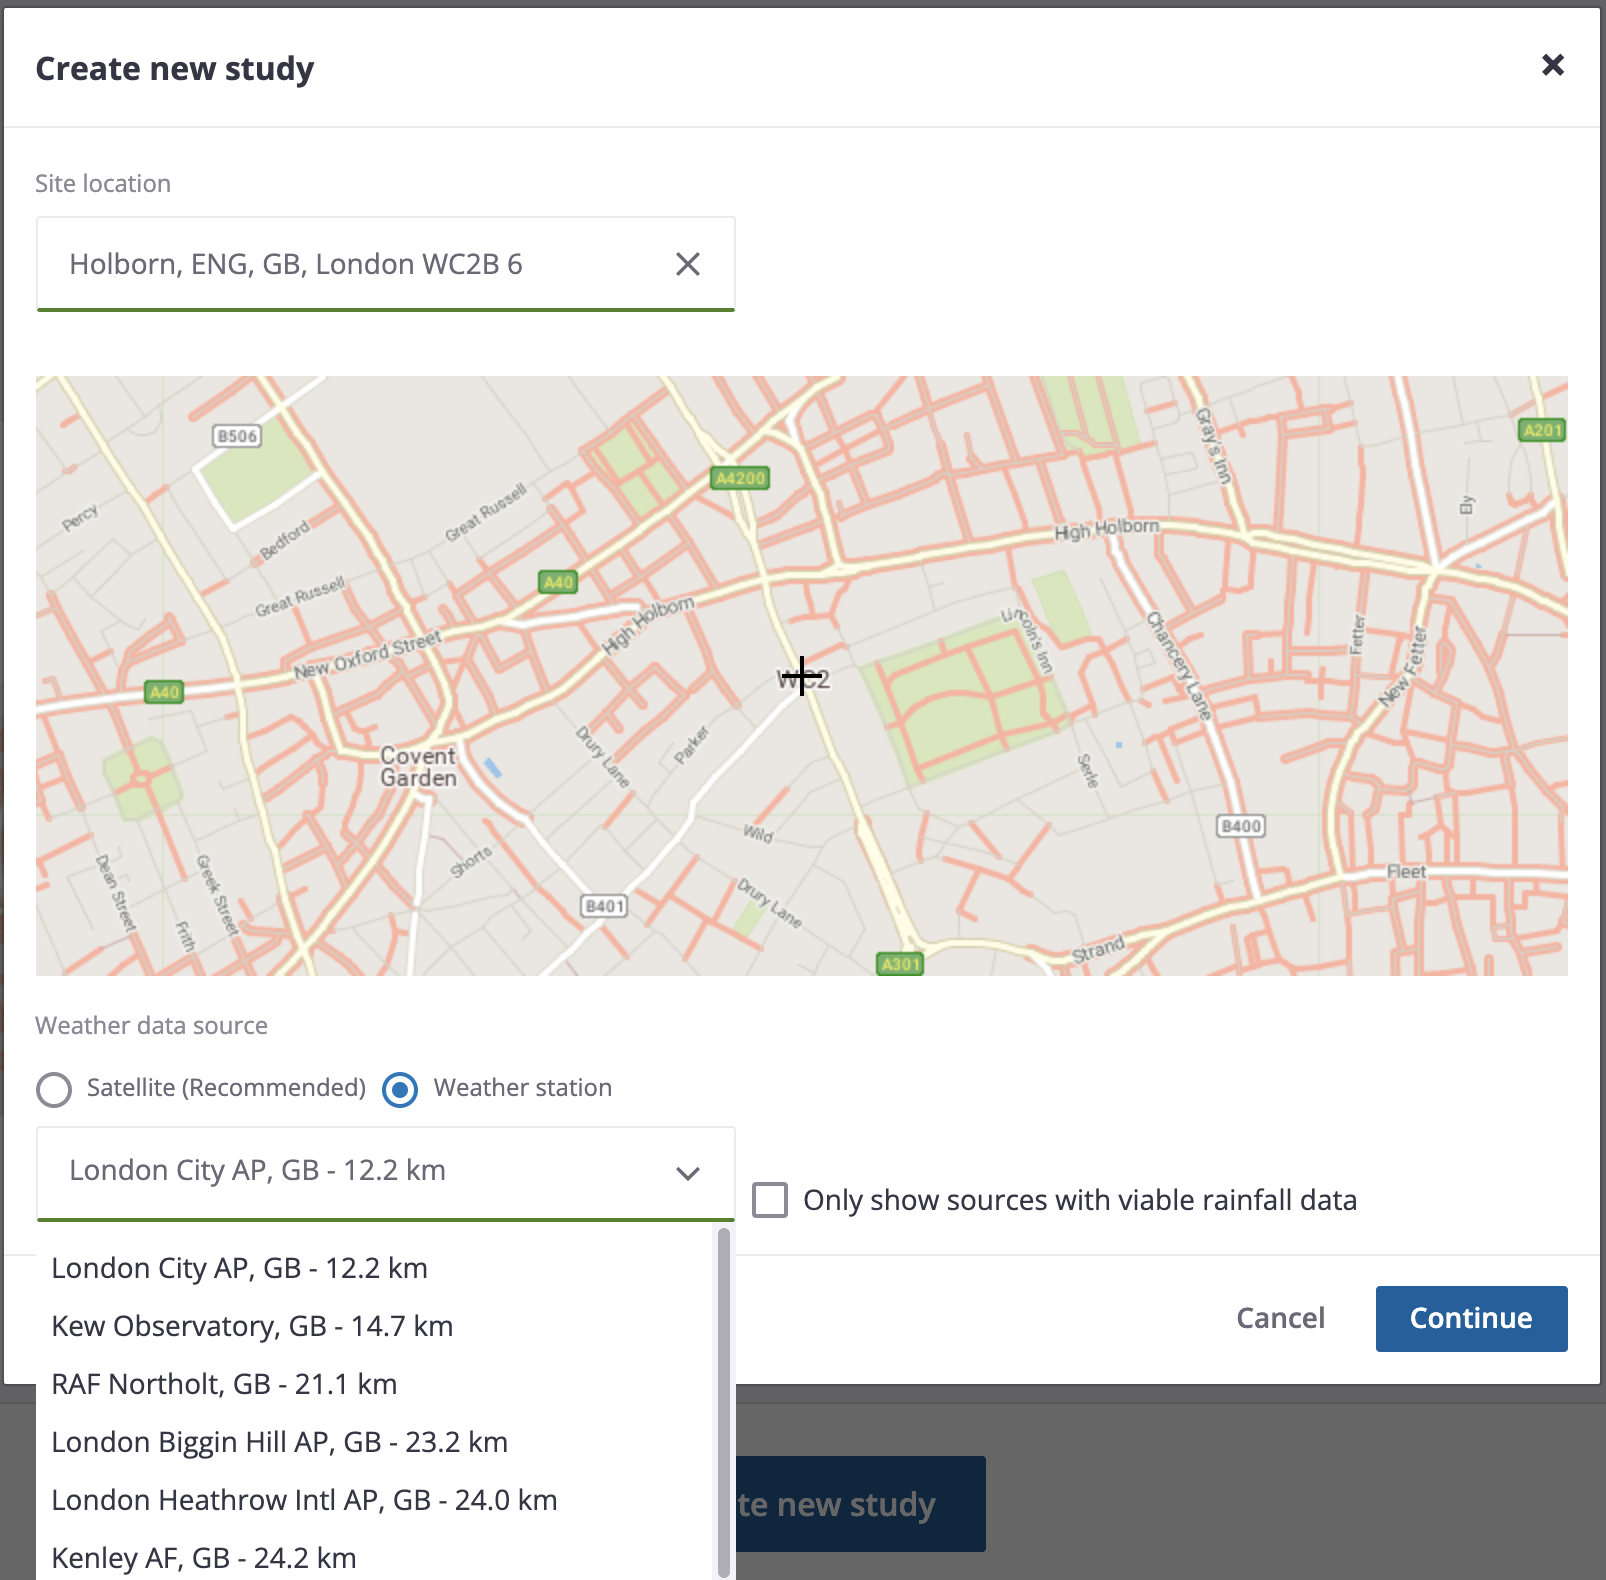
In this instance, PreDesign will list most relevant weather files in the “Weather data source” dropdown based on the “Site location” input. Order in which weather files are listed is based on the proximity of the weather file station to the site location and the status of the “Only show sources with viable rainfall data” checkbox.
Weather filenames typically include the location name, sometimes they include a specific site information (e.g. airport, observatory ...) followed by the country code and the distance from the selected “Site location”
“Only show sources with viable rainfall data” checked filters out and show only the weather files that have passed the rainfall validity test. This still does not guarantee the rainfall data will be accurate.
What the weather data is comprised of
Weather files have 30 different key meteorological values assigned to each hour of the year (total of 8760).
The most important ones that we use in PreDesign from both weather sources are:
- Dry bulb temperature
- Wet bulb temperature
- Relative humidity
- Global horizontal radiation
- Direct normal radiation
- Wind direction
- Wind speed
- Total sky cover
- Liquid precipitation depth
Satellite weather also uses:
- Snow depth
- Minutes of sunshine per hour
- Air Pollution (measured using Air Quality Index from CAMSGLOBAL data in 2018)
Most of the weather station files use hourly based statistical weather data that is based on Typical Meteorological Year (TMY). These files represent “normalised” data (ie they strive to avoid uncharacteristic events) by stitching together 12 “Typical” months from the full historical data set. This is done by others using a standard process.
For satellite weather, we have also normalised the data we use by looking up the “typical” months from the nearest weather station data and using those as the “typical” months for the satellite data. This means that satellite data should be pretty close to weather station data for the same location and it also means that unusual events are avoided (2020 for example was very unusual due to lockdowns and changes to industrial output in many places for example).
Which sites are covered
Satellite data is available on a 30km grid, meaning most sites will be no more than 20km from a measured point, no matter where you are in the world.
Weather station data covers around 14,000 locations worldwide. More information is available at (http://climate.onebuilding.org/default.html). Note we do not automatically update our data so we may not always have the latest files from that website available.
Our process for filtering out weather station and satellite data files
Every weather file is checked for the general data validity before it is used in PreDesign. This process mainly applies to weather station data.
The goal of the process is to search for the potential unexpected or abnormal values. A good example of a rejected weather file from the source would be if the file has an hour timestep where an outside air temperature is 100degC (212degF) or if throughout the whole year there is no wind at all.
Another example is a rainfall validity check where weather files are checked for the expected daily rainfall count distribution but not the amount.
If you feel that the weather file that you are using in your study has wrong values (unexpected for the given climate) please submit a bug (in PreDesign) and let us know.