How to explain the air pollution feature on the PreDesign seasons page
In any PreDesign study created using satellite weather data, you'll notice that there is information about air pollution that looks something like this:

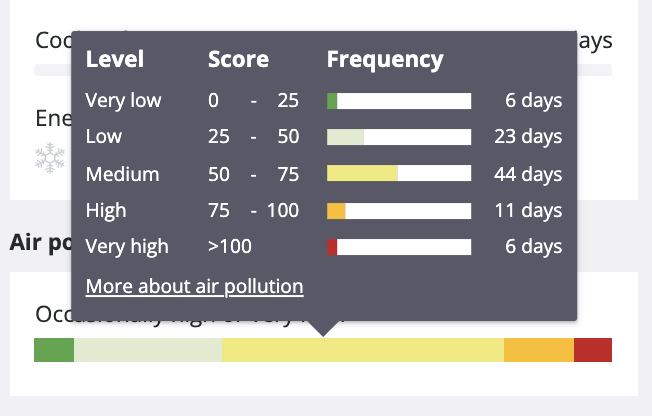
With a tooltip that looks like this:

Where and when is the information from
Our satellite weather provider, Meteoblue, provides air quality data with a 40km resolution worldwide. In some regions the resolution may be better (10km). We chose this data primarily because we had coverage for the entire world.
The information provided is the European Air Quality Index (CAQI) which breaks air pollution into 5 categories: Very Low, Low, Medium, High and Very High for every hour. The values represent background pollution - in other words it does not take into account being beside a busy road, it's the average pollution across a broader urban environment,
In PreDesign, we look at the average CAQI for each hour and determine an average value across the day. We then categorize days in terms of the air quality and represent those in the bar chart.
The pollution data does not go back as far as other data, so it is not aligned with the other information in terms of being a "typical" year (see the normalization section in this article). We decided to choose to use air quality data from the calendar year 2018, because it was:
- Complete
- From a year with no major volcanos (we were aware of)
- Pre-Covid (which greatly affected air pollution in many places.
What this information means
The statement can be used to describe how often the air pollution is high (shown in orange) or very high (shown in red). These are conditions where occupants may not want to be outside and may not want to open windows for ventilation as a result of there being too much air pollution. We felt this would probably have the biggest impact on architectural decisions.

If you hover over the chart, the tool tip shows how many days in the season achieved different averages.

What to do with this information
Knowing how often a region experiences poor air quality can help with architectural design in a range of ways. Generally speaking, if high or very high air pollution is frequently prevalent, you may want to consider the impact on:
- Suitability of outside space use. Higher pollution levels might lead to a lower level of desirability for outside spaces.
- Use of natural ventilation
- Air filtration requirements
- Long distance views
- Facade discoloration, especially for materials that are affected by air pollution.
In some regions people may be more used to bad air pollution than others. This is not considered in the data presented.